


This week, markets brace for a series of high-impact economic releases—including CPI data from Australia and the UK, U.S. GDP and unemployment claims, as well as retail sales and GDP figures from the UK and Canada. Against this backdrop, Crude Oil has rebounded from a 2025 low of $65.320 per barrel, with technical indicators suggesting near-term bullish momentum. Supply concerns, notably U.S. tariff threats on Venezuelan oil and a larger-than-expected 4.6 million barrel draw in U.S. inventories continue to influence the market dynamics.

Overview
This week, markets brace for a series of high-impact economic releases—including CPI data from Australia and the UK, U.S. GDP and unemployment claims, as well as retail sales and GDP figures from the UK and Canada. Against this backdrop, Crude Oil has rebounded from a 2025 low of $65.320 per barrel, with technical indicators suggesting near-term bullish momentum. Supply concerns, notably U.S. tariff threats on Venezuelan oil and a larger-than-expected 4.6 million barrel draw in U.S. inventories continue to influence the market dynamics.
Key Economic Events
Wednesday 02:30 am (GMT+2) - Austalia: CPI y/y (AUD)
Wednesday 09:00 am (GMT+2) - UK: CPI y/y (GBP)
Thursday 14:30 (GMT+2) - USA: Final GDP q/q (USD)
Thursday 14:30 (GMT+2) - USA: Unemployment Claims (USD)
Friday 09:00 am (GMT+2) - UK: Retail Sales m/m (GBP)
Friday 14:30 (GMT+2) - Canada: GDP m/m (CAD)
Friday 14:30 (GMT+2) - USA: Core PCE Price Index m/m (USD)
Technical Analysis
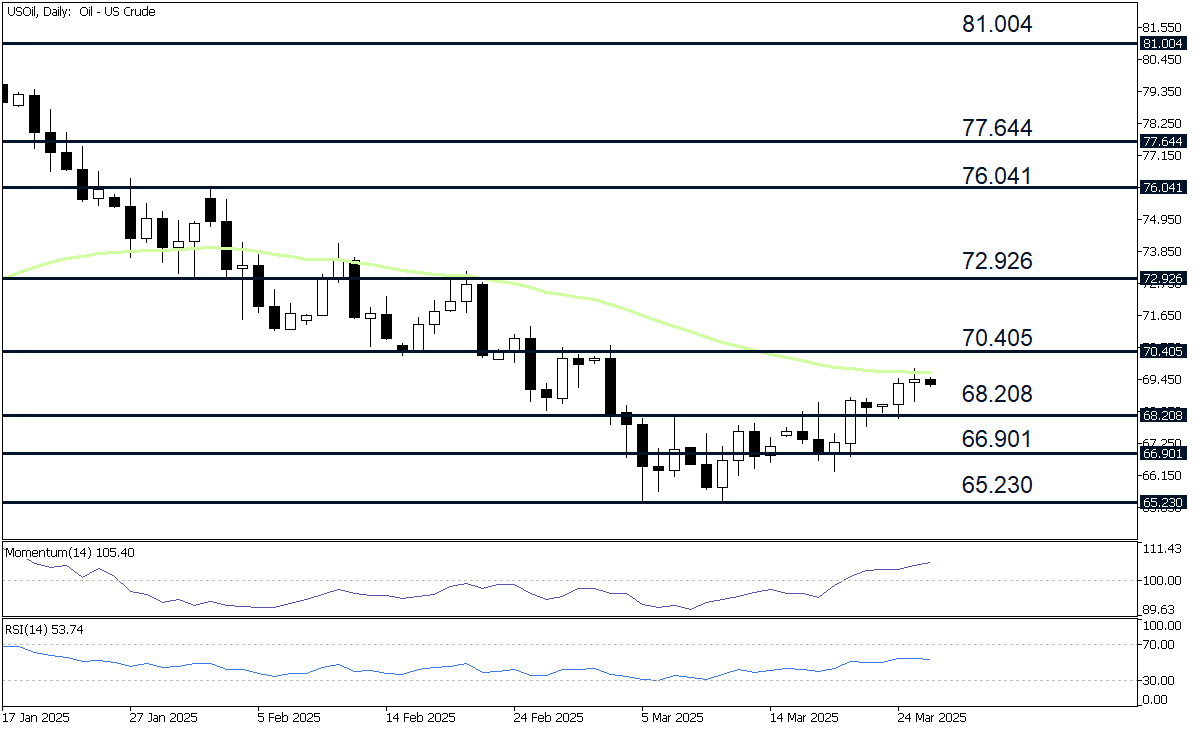
After reaching a 2025 low of $65.320 per barrel, Crude Oil has rebounded, supported by the emergence of a "failure swing" reversal pattern. The subsequent trough at $65.292 held above the prior low, followed by a break above the $68.208 resistance level—signaling a potential shift in the trend and the end of the recent downtrend.
While price action remains below the 50-period Exponential Moving Average (EMA), Crude Oil is now trading above the 20-period EMA, indicating an early recovery attempt. Momentum indicators further reinforce the near-term bullish bias: the Momentum Oscillator has moved above the 100 level, and the Relative Strength Index (RSI) has climbed above the 50 threshold—both pointing to strengthening upside momentum.
A bullish crossover, where the 20-period EMA rises above the 50-period EMA to form a "Golden Cross," would serve as a medium-term confirmation of trend reversal and likely intensify buying pressure. Until then, traders may view the current setup as cautiously constructive.
Potential Upside Targets
If buyers maintain control of the market, traders may shift their focus to the following four potential resistance levels:
70.405: The first level of resistance is determined at 70.405, which reflects the weekly resistance, R2, calculated using the standard Pivot Points methodology.
72.926: The second resistance level is observed at 72.926, which aligns with the 261.8% Fibonacci Extension drawn from 68.208 to 65.292.
76.041: The third price objective is projected at 76.041, representing the peak from February 2.
77.644: An additional price objective is projected at 77.644, representing the 423.6% Fibonacci Extension drawn from 68.208 to 65.292.
Potential Downside Targets
If sellers take control of the market, traders may focus on the following four key support levels:
68.208: The initial support level is estimated at 68.208, representing the swing high marked March 7.
66.901: The second support level is determined at 66.901, aligning with the weekly support, S1, estimated using the standard Pivot Points methodology.
65.230: The third support level is established at 65.230, reflecting the low point from March 5.
63.804: An additional downside target is noted at 63.804.
Fundamentals
Oil prices rose in early Wednesday trading as supply concerns mounted following U.S. President Trump's threat to impose 25% tariffs on countries importing Venezuelan oil. The move, along with Chevron's planned exit from Venezuela, could significantly cut production. Brent crude climbed to $73.24 and WTI to $69.53. Prices were further supported by a larger-than-expected 4.6 million barrel draw in U.S. crude inventories. However, gains were limited by a U.S.-brokered deal between Russia and Ukraine to pause attacks on energy infrastructure, potentially easing some geopolitical risk.
Conclusion
Crude Oil’s recent rebound from its 2025 low is supported by both technical signals and tightening supply concerns, though key resistance levels remain in play. With a full slate of high-impact economic data ahead—including inflation, GDP, and employment figures—market volatility is likely to persist. Traders should remain alert to geopolitical developments and macroeconomic signals, as these will be critical in shaping short-term price action and broader market sentiment.