


The most recent report from the Energy Information Administration (EIA) on July 17, 2024, indicated that Crude Oil inventories in the US decreased by 4.9 million barrels for the week ending July 12, 2024, which was lower than the -0.9 million barrels predicted by economists.
Despite causing a temporary surge in Crude Oil prices on the day of the report, the commodity has experienced a 5.3% decline compared to the week of June 30. The decline can also be attributed to the global economic slowdown and mixed economic indicators.

Overview
The most recent report from the Energy Information Administration (EIA) on July 17, 2024, indicated that Crude Oil inventories in the US decreased by 4.9 million barrels for the week ending July 12, 2024, which was lower than the -0.9 million barrels predicted by economists.
Despite causing a temporary surge in Crude Oil prices on the day of the report, the commodity has experienced a 5.3% decline compared to the week of June 30. The decline can also be attributed to the global economic slowdown and mixed economic indicators.
Key Economic Events
Friday 12:30 pm (GMT+0): Core PCE Price Index m/m (USD)
Technical Analysis
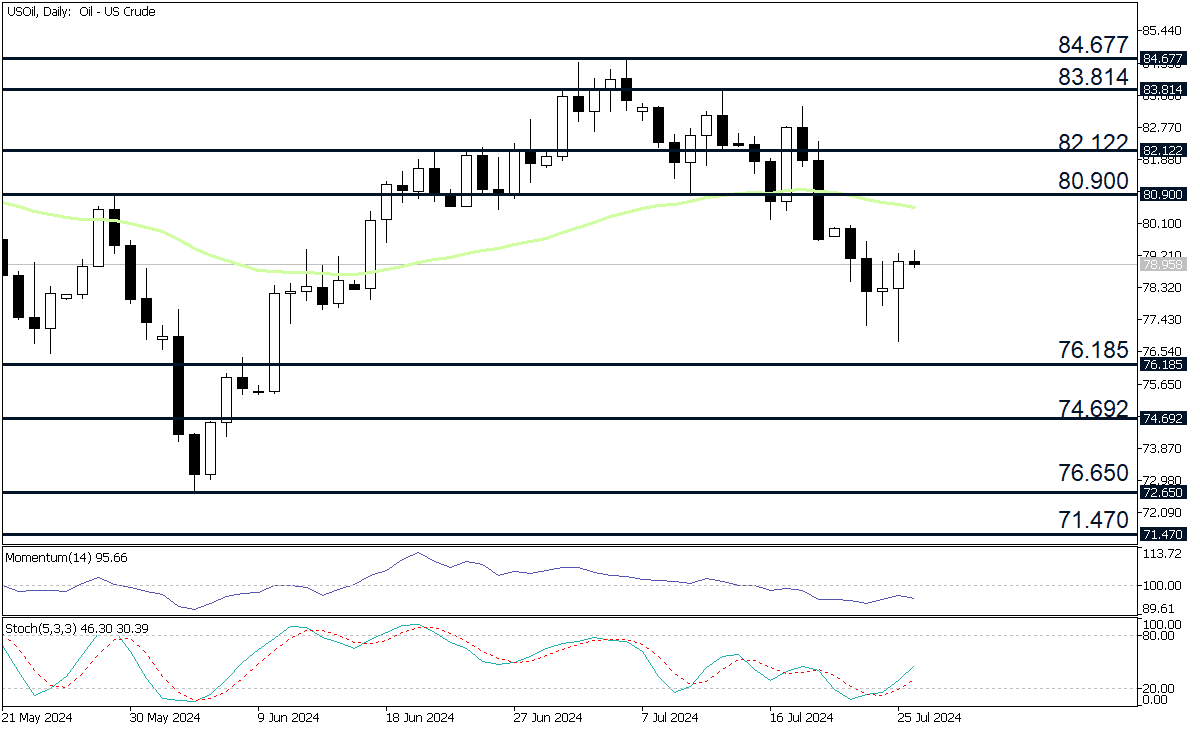
Crude Oil has been in a downtrend since hitting its highest price, $84.677 per barrel, in June. Since then, it has declined for three consecutive weeks, forming successively lower lows and lower highs. The formation of a bearish reversal on the price chart, known in technical analysis as a failure swing, opened the way for the descent. Specifically, the peak formed at 83.814 failed to exceed the previous peak, and instead, prices fell below the trough at 80.900, hence the failure swing. Both the 50-period Exponential Moving Average (EMA) and the Momentum oscillator support the bearish outlook for Crude Oil. In particular, prices fell below the EMA and the Momentum oscillator registers values below the 100 baseline. On another note, the Stochastics crossed below the oversold area, and both (%K and %D) rose above the 20 line, signaling a potential upward correction.
Potential Upside Targets
If the bulls manage to take control of the market, traders may consider the following four potential upside targets:
80.900: The first price target is 80.900, which matches the trough of the failure swing reversal and the weekly Pivot Point.
82.122: The price target for the second objective is 82.122, reflecting the R1 resistance computed using the weekly Pivot Point method.
83.814: An additional resistance level is set at 83.814, corresponding to the failed peak of the failure swing reversal.
84.677: The fourth price target is positioned at the daily high of 84.677, marked on July 5.
Potential Downside Targets
If the bears manage to maintain control of the market, traders may find potential opportunities in the following four downside targets:
76.185: The initial level of support is calculated at 76.185, corresponding to the 261.8% Fibonacci Extension drawn from the swing low of 80.900 to the swing high of 83.814.
76.650: The second downside target is expected to be 76.650, which corresponds to the daily low marked on June 4.
71.470: The third line of support is estimated at 71.470, aligning with the 423.6% Fibonacci Extension attached to the failure swing.
74.692: An additional support level is estimated at 74.692, representing the S3 support derived from the weekly Pivot Points.
Fundamental Analysis
According to the Energy Information Administration (EIA) latest report on July 17, 2024, US Crude Oil inventories fell by 4.9 million barrels for the week ending July 12, 2024, missing economists' projection of -0.9 million barrels. The decrease followed a 3.4 million barrel decline the previous week, which was contrary to economists' anticipated 0.8 million barrel increase. The current inventory of Crude Oil stands at approximately 440.2 million barrels, indicating a decrease of around 5% in comparison to the five-year average for this period. Despite a temporary surge in Crude Oil prices on the day of the report, the commodity experienced a 5.3% decline compared to the week of June 30 as of the time of writing.
Conclusion
Crude Oil has been in a downtrend since June, marked by weekly lower lows and lower highs. The bearish outlook has been triggered by the failure swing pattern and confirmed by the 50-period EMA and the Momentum oscillator. Despite the recent bearish signals, the Stochastic oscillator indicates a potential upward correction.
The latest EIA report revealed a larger-than-expected decrease in US Crude Oil inventories, highlighting ongoing volatility.
The market's attention now turns to significant economic events, particularly the Core PCE Price Index, which could influence future trends. In light of ongoing geopolitical and economic developments, it is essential for traders to remain cautious and flexible.