


Markets are entering a pivotal stretch with several high-impact economic events on the calendar, likely to influence global sentiment and currency direction. Key data releases from the U.S., Germany, Canada, and China — including GDP figures, inflation readings, and PMI data — will offer fresh insights into the health of major economies and the path of monetary policy. Meanwhile, GBPJPY remains in a strong uptrend, but signs of momentum divergence suggest a possible near-term pause. With global fundamentals diverging, traders are encouraged to stay alert as volatility may pick up in response to this week's economic developments.

Overview
Markets are entering a pivotal stretch with several high-impact economic events on the calendar, likely to influence global sentiment and currency direction. Key data releases from the U.S., Germany, Canada, and China — including GDP figures, inflation readings, and PMI data — will offer fresh insights into the health of major economies and the path of monetary policy. Meanwhile, GBPJPY remains in a strong uptrend, but signs of momentum divergence suggest a possible near-term pause. With global fundamentals diverging, traders are encouraged to stay alert as volatility may pick up in response to this week's economic developments.
Key Economic Events
Thursday 15:30 (GMT+3) – USA: Prelim GDP q/q (USD)
Thursday 15:30 (GMT+3) – USA: Unemployment Claims (USD)
Friday All Day – Germany: Prelim CPI m/m (EUR)
Friday 15:30 (GMT+3) – Canada: GDP m/m (CAD)
Friday 15:30 (GMT+3) – USA: Core PCE Price Index m/m (USD)
Saturday 4:30 am (GMT+3) – China: Manufacturing PMI (CNY)
Technical Analysis
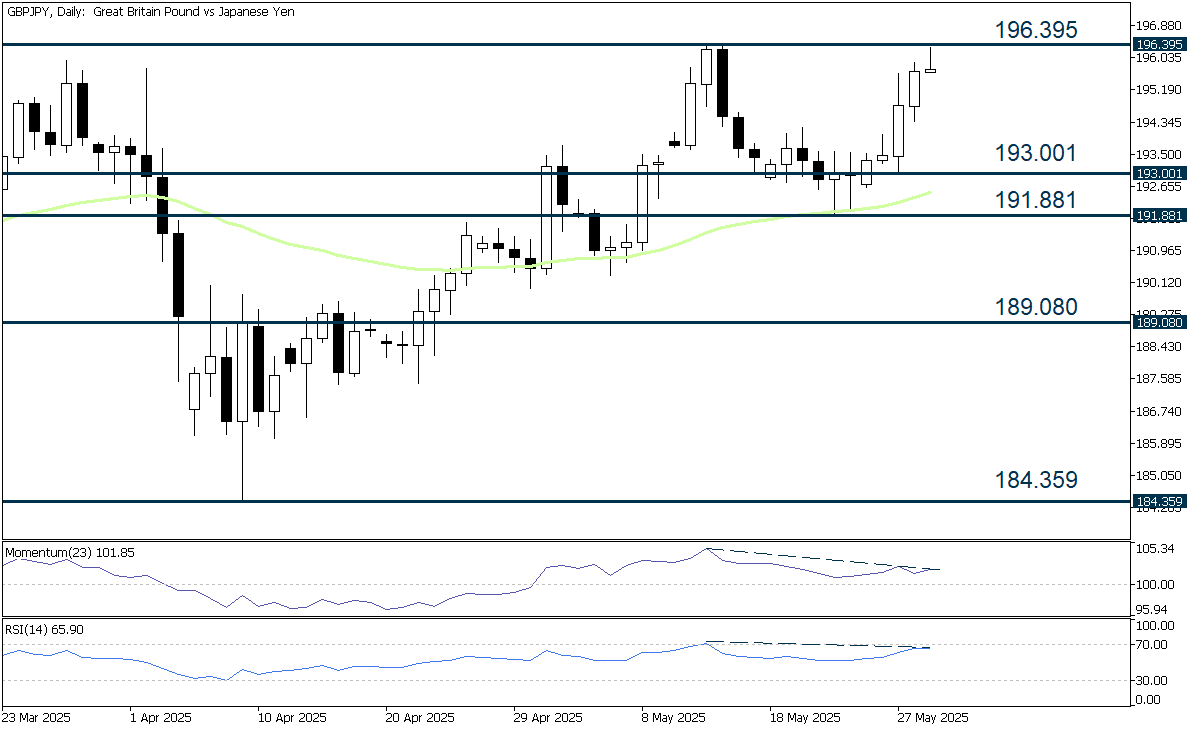
Since establishing a low of 184.359 on April 9, GBPJPY has been in a sustained uptrend, characterized by a series of higher highs and higher lows — a classic sign of strong bullish momentum. A decisive breakout above the key resistance level at 196.395 would likely open the path to further gains.
The initial bullish reversal was signaled by a Bullish White Body candle, followed by a failure swing where the trough at 187.452 held above the previous low. This structure was confirmed as price action exceeded the prior peak at 189.610, reinforcing the upward trajectory.
Momentum has been further supported by a "Golden Cross" pattern, with the 20-period EMA crossing above the 50-period EMA — a signal often associated with medium-term trend strength. In addition, technical indicators continue to reflect a bullish bias: the Relative Strength Index (RSI) remains above the 50 threshold, and the Momentum Oscillator holds above the 100 level.
That said, emerging negative divergence between the price and both the RSI and Momentum Oscillator suggests waning momentum, raising the possibility of a near-term consolidation or corrective pullback before the broader trend resumes. Traders may want to monitor these divergences closely for signs of exhaustion in the current rally.
Potential Upside Targets
If the bulls maintain control of the market, traders may consider the following four potential upside targets:
196.395: The first resistance is established at 196.395, corresponding to the daily high from May 14.
199.185: The second price target is identified at 199.185, representing the 161.8% Fibonacci Extension drawn from 196.395 to 191.881.
203.699: The third price target level is established at 203.699, corresponding to the 261.8% Fibonacci Extension drawn from 196.395 to 191.881.
208.110: An additional price objective is recognized at 208.110, aligning with the daily high marked on July 11.
Potential Downside Targets
If the bears take control of the market, traders may find potential opportunities in the following four downside targets:
193.001: The initial level of support is seen at 193.001, corresponding to the weekly Pivot Point (PP) calculated using the standard method.
191.881: The second level of support is identified at 191.881, which corresponds to the trough from May 22.
189.080: The third level of support is established at 189.080, representing the 161.8% Fibonacci Extension drawn from 191.881 to 196.395.
184.359: An additional support is observed at 184.359, corresponding to the low point marked on April 9.
Fundamentals
Retail sales volumes in Great Britain rose by 1.2% in April 2025, marking the fourth consecutive monthly increase and the strongest three-month growth since July 2021. The rebound was driven largely by a 3.9% jump in food store sales, with retailers crediting favorable weather conditions. While most sectors saw gains, sales dipped in clothing and other non-food stores following strong performances in March. Online sales fell slightly by 0.3% month-on-month, lowering the online share of total retail sales to 26.8%.
On the other hand, Japan's economy shrank more than expected in Q1 2025, with GDP falling 0.2% quarter-on-quarter and 0.7% year-on-year, driven by weak consumption and a sharp drop in exports. The downturn comes amid growing uncertainty tied to U.S. President Trump's trade policies, including steep tariffs on Japanese goods and autos set to take effect in July. Economists warn that Japan, already grappling with structural challenges like an aging population and limited domestic demand, faces heightened recession risk if trade tensions escalate further.
Conclusion
With key economic indicators set to be released across major economies, market participants should prepare for heightened volatility and potential shifts in sentiment. While GBPJPY maintains its bullish structure, technical divergences and mixed global fundamentals—such as the UK's retail resilience and Japan's economic contraction—underscore the importance of a cautious and flexible approach. How this data unfolds may offer critical clues for short-term positioning and broader macro trends in the days ahead.