


This week, key economic events and central bank decisions are shaping market sentiment, with major data releases from Australia, Switzerland, the UK, the US, and Canada. Investors are closely monitoring these developments for potential shifts in monetary policy and economic outlooks.
Meanwhile, Gold continues its strong rally, reaching new highs above $3,057 per ounce amid ongoing market uncertainty and risk aversion. Technical indicators confirm the bullish trend, though signs of divergence suggest a potential slowdown or correction. As traders navigate these volatile conditions, attention remains on key resistance and support levels, as well as broader macroeconomic factors influencing market direction.

Overview
This week, key economic events and central bank decisions are shaping market sentiment, with major data releases from Australia, Switzerland, the UK, the US, and Canada. Investors are closely monitoring these developments for potential shifts in monetary policy and economic outlooks.
Meanwhile, Gold continues its strong rally, reaching new highs above $3,057 per ounce amid ongoing market uncertainty and risk aversion. Technical indicators confirm the bullish trend, though signs of divergence suggest a potential slowdown or correction. As traders navigate these volatile conditions, attention remains on key resistance and support levels, as well as broader macroeconomic factors influencing market direction.
Key Economic Events
Thursday 02:30 am (GMT+2) - Australia: Employment Change (AUD)
Thursday 10:30 am (GMT+2) - Switzerland: SNB Policy Rate (CHF)
Thursday 14:00 (GMT+2) - UK: Official Bank Rate (GBP)
Thursday 14:30 (GMT+2) - USA: Unemployment Claims (USD)
Friday 14:30 (GMT+2) - Canada: Core Retail Sales m/m (CAD)
Technical Analysis
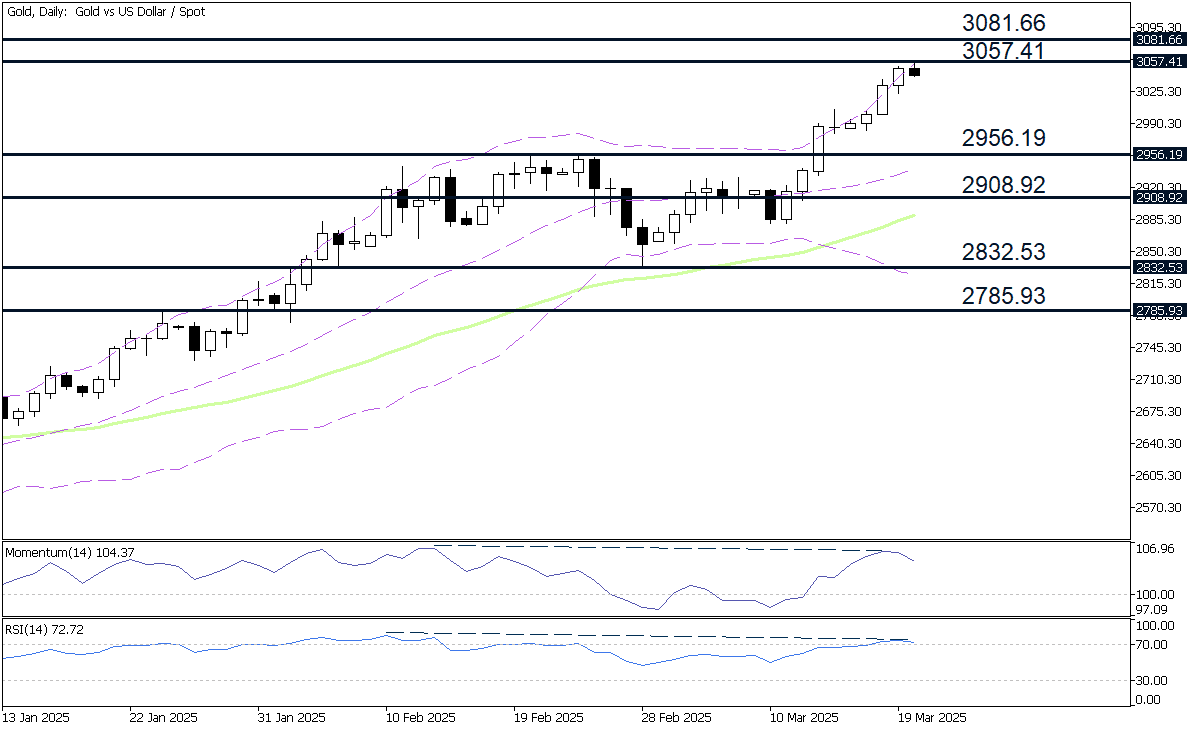
Since reaching a low of $2,536.79 per troy ounce on November 14, Gold has been in a strong uptrend, supported by both technical and fundamental factors. The precious metal has consistently set new record highs, with today's peak at $3,057.41, reflecting sustained bullish momentum.
From a technical perspective, key indicators reinforce the prevailing uptrend. Gold remains well above the 50-period Exponential Moving Average (EMA), signaling continued upside pressure. The Momentum Oscillator holds above the critical 100 level, and the Relative Strength Index (RSI) stays above 50, confirming persistent buying interest. Additionally, prices have closed above the Upper Bollinger Band, further suggesting a near-term continuation of the rally.
However, caution is warranted as a negative divergence emerges between price action and momentum indicators. The decoupling of the Momentum Oscillator and RSI from Gold’s ascent suggests a potential slowdown or corrective pullback before the uptrend resumes. Traders should monitor these signals closely for signs of weakening momentum.
Potential Upside Targets
Should the bulls maintain market control, traders may direct their attention toward the four potential resistance levels below:
3057.41: The initial resistance is 3057.41, which represents today's daily high.
3081.66: The second price target is identified at 3081.66, corresponding to the weekly resistance, R2, estimated using the standard Pivot Points methodology.
3156.27: The third target is established at 3156.27, aligning with the 261.8% Fibonacci Extension drawn from the high point, 2956.17, to the low point, 2832.53.
3356.35: An additional price target is estimated at 3356.35, corresponding to the 423.6% Fibonacci Extension drawn from 2956.17 to 2832.53.
Potential Downside Targets
Should the sellers take market control, traders may consider the four potential support levels listed below:
2956.19: The first level of support is determined at 2956.19, representing the peak from February 24.
2908.92: The second support level is identified at 2908.92, reflecting the weekly support, S1, estimated using the standard Pivot Points methodology.
2832.53: The third support level is seen at 2832.53, corresponding to the trough formed on February 28.
2785.93: An additional downward target is observed at 2785.93, corresponding to the peak marked January 24.
Fundamentals
Gold prices have surged past $3,057 per ounce, driven by market uncertainty and investor demand for safe-haven assets. The rally, fueled by global trade tensions and stock market volatility, has seen Gold gain 16% this year, while major equity indices, including the S&P 500 and Nasdaq, have declined.
Analysts caution that while Gold has historically performed well during stock market downturns, it remains a volatile asset. BNP Paribas has raised its gold price forecast but expects gains to ease later in the year as markets adjust to trade risks. Experts recommend portfolio diversification, warning against relying solely on Gold for stability.
Conclusion
As the week unfolds, key economic events and central bank decisions continue to shape market sentiment, while Gold maintains its strong rally amid heightened uncertainty. Despite bullish technical indicators, signs of divergence suggest a potential slowdown or correction, making risk management crucial for traders. Investors should remain vigilant, closely monitoring economic data releases and broader macroeconomic developments that could influence market direction in the days ahead.