


Key economic data releases, including Canada's Employment Change and the US Nonfarm Payrolls, are set to influence market movements this week. Following a bearish reversal pattern in the NASDAQ 100 Index, the focus has shifted toward technical indicators that suggest potential downside targets. With prices falling below key levels and a weakening tech sector, traders are watching both the bearish momentum and potential upside opportunities. Additionally, fundamentals such as investor concerns over an economic slowdown and weaker-than-expected data in the technology industry add to market uncertainty.

Overview
Key economic data releases, including Canada's Employment Change and the US Nonfarm Payrolls, are set to influence market movements this week. Following a bearish reversal pattern in the NASDAQ 100 Index, the focus has shifted toward technical indicators that suggest potential downside targets. With prices falling below key levels and a weakening tech sector, traders are watching both the bearish momentum and potential upside opportunities. Additionally, fundamentals such as investor concerns over an economic slowdown and weaker-than-expected data in the technology industry add to market uncertainty.
Key Economic Events
Friday 15:30 (GMT+3) - Canada: Employment Change (CAD)
Friday 15:30 (GMT+3) - USA: Nonfarm Payrolls (USD)
Friday 17:00 (GMT+3): Canada: Ivey PMI (CAD)
Technical Analysis
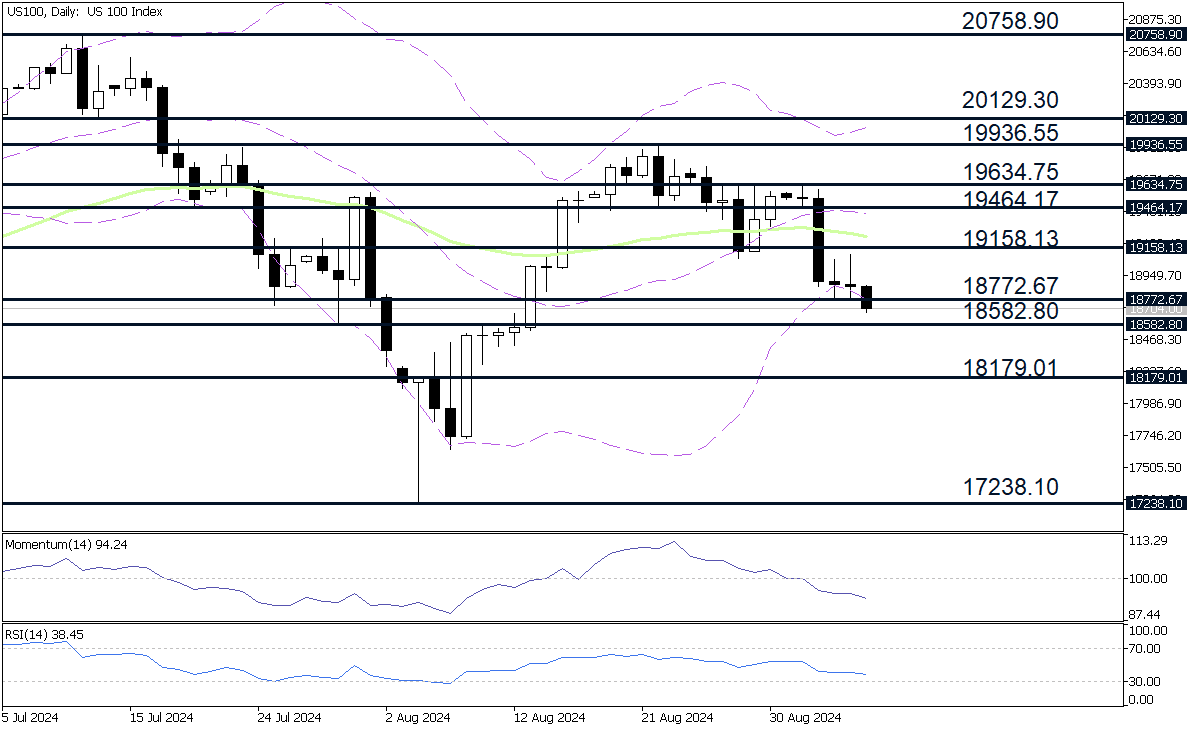
After reaching a high price of 19936.55 on August 22, the NASDAQ 100 Index formed a bearish reversal known as a failure swing in technical analysis. Specifically, the peak at 19634.75 failed to exceed the previous peak, and instead, prices dropped below the trough at 19078.70. By attaching the Fibonacci Retracement tool from the swing low to the swing high, we can estimate three potential downside targets: 18772.67, 18179.01, and 17238.10. The 50-period Exponential Moving Average (EMA), the Momentum oscillator, and the Relative Strength Index (RSI) all support the downward trend of the index. Specifically, prices are below the 50-period EMA, the Momentum is below the 100 baseline, and the RSI values are below 50. A decisive close below the Lower Bollinger Band will signal the continuation of the downtrend.
Potential Upside Targets
If the bulls take control of the market, traders may consider the following four potential upside targets:
19158.13: The first price target is seen at 19158.13, which corresponds to the weekly resistance (S1) calculated using the standard Pivot Points method.
19464.17: The second price target is identified at 19464.17, representing the weekly Pivot Point (PP) calculated using the standard method.
19634.75: The third resistance level is established at 19634.75, representing the swing high marked on September 2.
19936.55: An additional resistance is recognized at 19936.55, aligning with the swing high formed on August 22.
Potential Downside Targets
If the bears maintain control of the market, traders may find potential opportunities in the following four downside targets:
18772.67: The initial level of support is established at 18772.67, corresponding to the weekly support (S2) calculated using the standard method.
18582.80: The second level of support is 18582.80, which corresponds to a daily high marked on August 9.
18179.01: The third level support is 18179.01, representing the 261.8% Fibonacci Extension between the swing low 19078.70 and the swing high 19634.75.
17238.10: An additional support is located at 17238.10, reflecting a daily low marked on August 5.
Fundamentals
The technology index has dropped by more than 7% since reaching its peak in 2024. This decline is attributed to investors reducing their optimism about artificial intelligence and weak economic data. Chip stocks such as Nvidia have fallen by over 17% since their 2024 peak. Concerns about seasonal trends, as September historically poses challenges for stocks, have also added to the selloff. Moreover, investor anxiety about a potential economic slowdown was amplified by the ISM manufacturing report, which indicated continued contraction for the fifth consecutive month.
Conclusion
In conclusion, the NASDAQ 100 Index is facing significant downward pressure, driven by bearish technical indicators and weakening fundamentals in the technology sector. Key economic events, such as Canada's Employment Change and the U.S. Nonfarm Payrolls, are likely to influence market direction in the near term. While potential downside targets are being closely watched, there are also opportunities for upside if bulls regain control. However, broader concerns over a potential economic slowdown and persistent market volatility will continue to weigh on investor sentiment, especially as weak economic data and seasonal trends pose additional risks.