


The financial markets continue to show resilience, with equities maintaining their bullish momentum and key indices reaching new highs. The S&P 500 has extended its uptrend, supported by strong technical signals that reinforce positive market sentiment. While momentum remains intact, traders are closely monitoring the price action for confirmation of further upside or potential retracements. With market participants navigating shifting trends, attention remains on key technical levels that could define the next moves in price action.

Overview
The financial markets continue to show resilience, with equities maintaining their bullish momentum and key indices reaching new highs. The S&P 500 has extended its uptrend, supported by strong technical signals that reinforce positive market sentiment. While momentum remains intact, traders are closely monitoring the price action for confirmation of further upside or potential retracements. With market participants navigating shifting trends, attention remains on key technical levels that could define the next moves in price action.
Key Economic Events
Thursday 02:30 am (GMT+2) - Australia: Employment Change (AUD)
Thursday 15:30 (GMT+2) - USA: Unemployment Claims (USD)
Friday 09:00 am (GMT+2) - UK: Retail Sales m/m (GBP)
Friday 10:15 am (GMT+2) - France: Flash Manufacturing PMI (EUR)
Friday 10:15 am (GMT+2) - France: Flash Services PMI (EUR)
Friday 10:30 am (GMT+2) - Germany: Flash Manufacturing PMI (EUR)
Friday 10:30 am (GMT+2) - Germany: Flash Services PMI (EUR)
Friday 11:30 am (GMT+2) - UK: Flash Manufacturing PMI (GBP)
Friday 11:30 am (GMT+2) - UK: Flash Services PMI (GBP)
Friday 15:30 (GMT+2) - Canada: Retail Sales m/m (CAD)
Friday 16:45 (GMT+2) - USA: Flash Manufacturing PMI (USD)
Friday 16:45 (GMT+2) - USA: Flash Services PMI (USD)
Technical Analysis
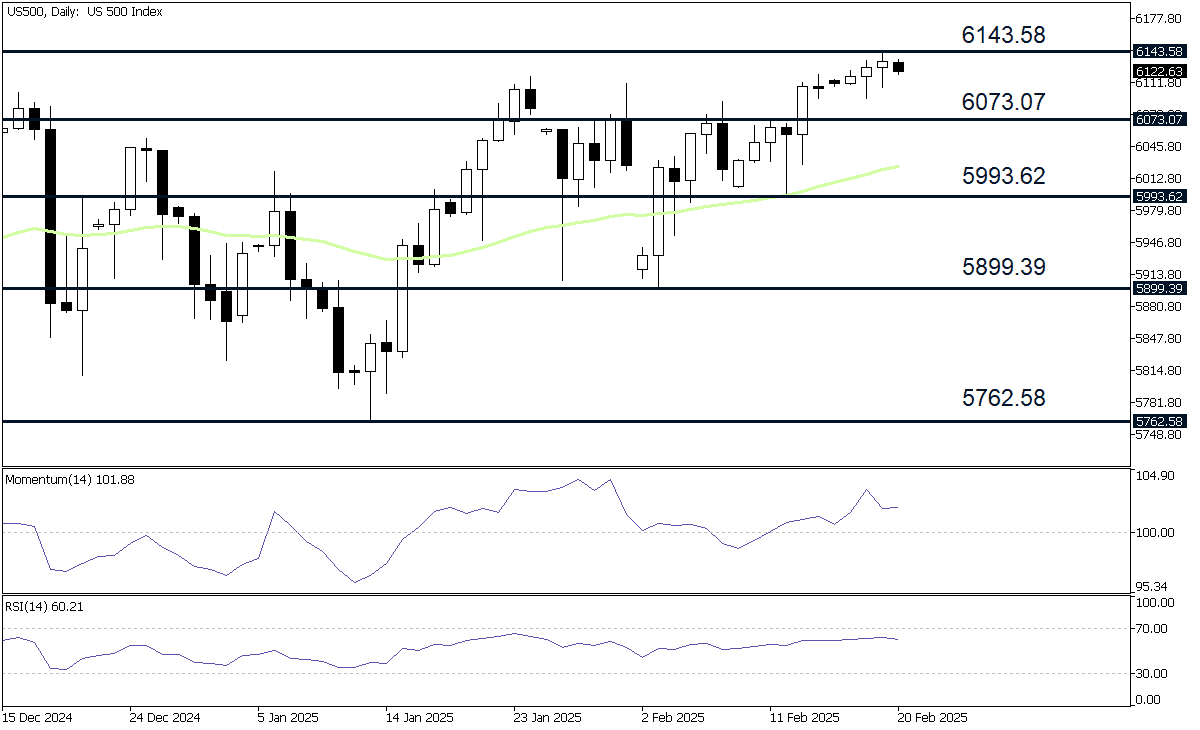
Following a rebound from the 5,762.58 low on January 13, the S&P 500 Index has demonstrated a strong recovery, extending its uptrend and posting fresh all-time highs. The formation of a Bullish Engulfing candlestick pattern underscored the inability of sellers to maintain downward momentum, while the subsequent break above the 50-period Exponential Moving Average (EMA) confirmed bullish control.
From a technical standpoint, the index has strengthened further, forming a Golden Cross, where the 20-period EMA crossed above the 50-period EMA—a historically bullish signal that suggests continued upside potential.
Momentum indicators reinforce this positive outlook. The Momentum Oscillator has surpassed the 100 threshold, while the Relative Strength Index (RSI) remains above 50, both indicating sustained buying pressure. These factors collectively point to a broader bullish bias, with further gains likely as long as price action remains above key support levels.
Potential Upside Targets
If buyers maintain control of the market, traders may shift their focus to the following four potential resistance levels:
6143.58: The first level of resistance is determined at 6,143.58, which reflects the all-time high marked February 19.
6199.64: The second resistance level is observed at 6,199.64, which aligns with the weekly resistance, R2, estimated using the standard Pivot Points methodology.
6252.25: The third price objective is projected at 6,252.25, representing the 261.8% Fibonacci Extension drawn from the high point, 6,092.41, to the low point, 6,993.62.
6412.09: An additional price objective is projected at 6,412.09, representing the 423.6% Fibonacci Extension drawn from the high point, 6,092.41, to the low point, 6,993.62.
Potential Downside Targets
If sellers take control of the market, traders may focus on the following four key support levels:
6073.07: The initial support level is estimated at 6,073.07, representing the weekly Pivot Point, PP, estimated using the standard methodology.
5993.62: The second support level is determined at 5,993.62, aligning with the swing low from February 12.
5899.39: The third downside target is observed at 5,899.39, corresponding to the weekly support, S3, calculated using the standard Pivot Points methodology.
5762.58: An additional downside target is noted at 5762.58, reflecting the daily low marked January 13.
Fundamentals
U.S. stocks closed higher on Wednesday, with the S&P 500 reaching another record at 6,143.58, rising 0.2%. Investors assessed President Trump's latest 25% tariff threats on autos, semiconductors, and pharmaceuticals, set to take effect in April.
The Federal Reserve's January meeting minutes revealed most officials favor maintaining a restrictive policy stance due to inflation concerns, though potential rate cuts remain on the table if economic conditions weaken. Despite these uncertainties, markets remained stable, with Treasury yields easing to 4.53%. Investors continue to bet on the Fed's next move, which is a rate cut, reinforcing market stability for now.
Conclusion
The market's bullish momentum remains intact, with the S&P 500 continuing its upward trajectory and reaching new record highs. Strong technical indicators support this trend, though traders should remain cautious of potential retracements at key support levels. While economic and policy uncertainties persist, investor sentiment remains positive, driven by expectations of future monetary easing. Moving forward, market participants will closely watch price action for further confirmation of sustained strength or signs of a potential shift in momentum.